Bitcoin’s Bearish Battle: Key Levels to Watch
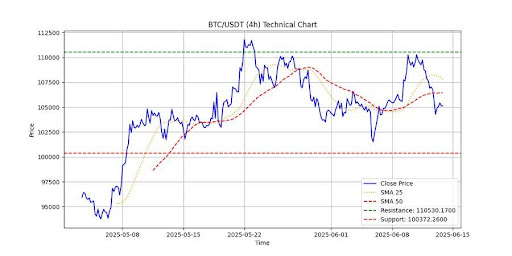
Bitcoin (BTC) is facing renewed pressure as it slips below critical short-term moving averages, trading around $105,148. The cryptocurrency has fallen beneath both the 25-period and 50-period Simple Moving Averages (SMAs), signaling a potential shift in momentum favoring bears. With key technical indicators flashing caution, the question on every trader’s mind is: Can bulls stage a comeback?

Why the Moving Averages Matter
Moving averages act as dynamic support and resistance levels, helping traders gauge market sentiment. The recent breakdown below the 25-period and 50-period SMAs suggests:
- Short-term weakness: The inability to hold above these levels indicates fading bullish momentum.
- Potential trend reversal: A sustained drop could signal further downside if buyers don’t step in.
- Increased selling pressure: Bears may exploit this breakdown to push prices lower.
Key Levels for Bitcoin Traders
For BTC to regain bullish footing, it must reclaim the following levels:
- $107,000: A break above this resistance could invalidate the bearish SMA crossover.
- $105,000 (current support): Holding here is critical to prevent a deeper correction.
- $102,000: A fall below this level may trigger accelerated selling.
What’s Next for Bitcoin?
While the short-term outlook appears bearish, Bitcoin has a history of defying expectations. Factors that could reignite bullish momentum include:
- Institutional buying: Large investors accumulating at lower prices.
- Macroeconomic shifts: Favorable Fed policy or ETF inflows.
- On-chain strength: Long-term holders refusing to sell.
The bottom line: Bitcoin is at a crossroads. Traders should watch the $105K level closely—holding it could set the stage for a rebound, while a breakdown may lead to further downside. Stay nimble and monitor volume trends for confirmation.