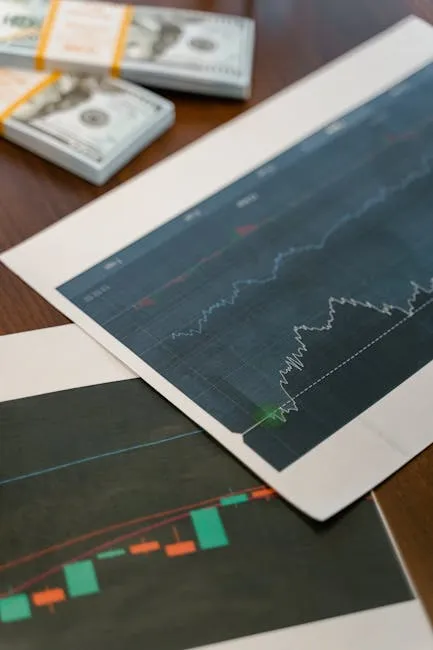
Key Bitcoin Charts to Watch Following Record Weekly High
Bitcoin has recently made headlines with a record weekly close above $123,000, marking a significant milestone in its price journey. This new peak not only highlights the cryptocurrency’s potential but also signals a fresh phase of price discovery. As bulls take the reins, several important charts are emerging that traders and investors should keep a close eye on. In this article, we will explore these charts and what they indicate for the future of Bitcoin.
The Significance of the Weekly Close
The weekly close of Bitcoin above $123,000 is more than just a number; it reflects a robust bullish sentiment in the market. Such a close indicates that buyers are willing to step in at higher price levels, suggesting a strong demand for Bitcoin. This shift in sentiment can often lead to further price appreciation as more investors are drawn to the asset.
Chart 1: On-Chain Metrics
One of the primary charts that bulls are monitoring revolves around on-chain metrics. These metrics provide insights into the activity occurring on the Bitcoin blockchain, including transaction volumes and wallet movements. A rise in on-chain activity often correlates with price increases, as it indicates growing interest and adoption.
For instance, if we observe a consistent uptick in transactions and wallet addresses, it suggests that more individuals are investing in or using Bitcoin. This kind of data can help traders identify potential bullish trends before they manifest in price movements.
Chart 2: Futures Market Indicators
Another critical area to watch is the futures market. Bitcoin futures allow traders to speculate on the future price of the cryptocurrency. Charts displaying futures market metrics, such as open interest and funding rates, can offer valuable insights into market sentiment.
A high open interest, combined with positive funding rates, often indicates that more traders are betting on Bitcoin’s price rising. This bullish sentiment can lead to price surges as more capital flows into the market. Therefore, tracking these futures market indicators is essential for anticipating potential price movements.
Chart 3: Technical Analysis Patterns
Technical analysis remains a fundamental aspect of trading, and Bitcoin is no exception. Chart patterns such as support and resistance levels, moving averages, and trend lines can provide crucial signals for traders. The recent weekly close above $123,000 has created new support levels that traders will likely use to gauge potential entry points.
For example, if Bitcoin holds above this new support level, it may indicate a stronger bullish trend, encouraging more buying. Conversely, if it falls below, it could trigger sell-offs, leading to a potential price correction. Hence, technical charts will be instrumental in assessing market conditions in the aftermath of this historic close.
Conclusion
As Bitcoin continues to navigate this exciting new phase of price discovery, keeping an eye on these key charts is essential for anyone invested in or considering investing in the cryptocurrency. The combination of strong on-chain metrics, futures market indicators, and technical analysis patterns paints a promising picture for Bitcoin’s future. For traders and investors, understanding these elements can provide a significant edge in this dynamic market.
With the bulls firmly in control, the journey ahead looks intriguing. Stay informed and ready to adapt as the market evolves.


