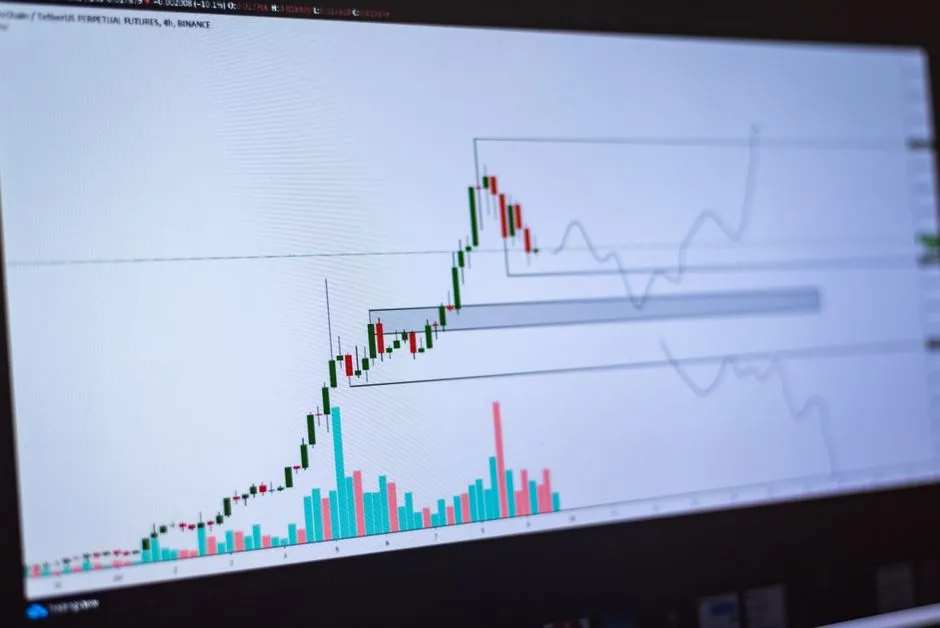
The cryptocurrency market never sleeps, and neither do the veteran traders who have spent decades navigating its wild swings. Among the most respected voices in technical analysis is Peter Brandt, a seasoned commodity and crypto trader known for his precise chart reading and straightforward market outlook. Recently, Brandt has turned his attention back to Bitcoin, issuing a bearish warning that has traders paying close attention. His latest analysis points to a completed head and shoulders breakdown, with a potential price retest hovering near the $58,000 mark.
Understanding the Head and Shoulders Breakdown
For those unfamiliar with technical analysis, the head and shoulders pattern is one of the most reliable reversal signals on a price chart. It typically forms after a prolonged uptrend and consists of three distinct peaks: a middle peak (the head) that is higher than the two surrounding peaks (the shoulders). The line connecting the lows of these peaks is known as the neckline. When the price breaks below this neckline with conviction, it often signals that the previous bullish momentum is losing steam and a downward correction may be underway.
Brandt’s observation of a completed breakdown suggests that Bitcoin’s recent rally may have exhausted its short-term buying pressure. Rather than continuing to push toward new highs, the asset could be entering a consolidation or correction phase. This isn’t necessarily a prediction of a long-term crash, but rather a technical reset that allows the market to digest recent gains and rebuild a stronger foundation.
How Chart Patterns Influence Market Psychology
Technical patterns matter because they reflect collective trader behavior. When a well-known pattern like the head and shoulders forms, it often triggers automated selling algorithms, stop-loss orders, and cautious positioning from institutional desks. The psychological weight of a neckline breakdown can accelerate price movement, creating a self-fulfilling dynamic. Brandt’s public warning amplifies this effect, reminding traders to pay close attention to support levels and risk management rather than chasing momentum blindly.
The $58,000 Support Zone: What’s at Stake?
If Bitcoin begins to retrace, the $58,000 level stands out as a critical area of interest. Historically, this zone has acted as a strong support floor during previous market cycles. It represents a cluster of past buying activity, liquidity pools, and psychological benchmarks that retail and institutional investors watch closely. A retest of this level could result in a brief bounce, a period of sideways consolidation, or a deeper dip if broader market conditions turn hostile.
It is important to remember that support levels are not hard guarantees. They are dynamic zones where supply and demand interact. If selling pressure overwhelms buyers at $58,000, the price could slide toward the next major support structure. Conversely, if buyers step in aggressively, this level could serve as a springboard for the next leg up. The key lies in volume confirmation and how the market reacts on the daily and weekly timeframes.
Broader Market Context and Macro Influences
While technical charts provide a clear snapshot of price action, they never exist in a vacuum. Bitcoin’s trajectory is heavily influenced by macroeconomic factors, including interest rate expectations, inflation data, regulatory developments, and overall risk appetite in traditional financial markets. When traditional markets experience volatility, crypto assets often feel the ripple effect. Brandt’s bearish outlook should be viewed alongside these broader currents, as they can either validate or override technical signals.
Navigating Volatility: Practical Strategies for Traders
Facing a potential pullback can be nerve-wracking, but it also presents opportunities for disciplined market participants. Here are a few practical approaches to consider when navigating uncertain price action:
- Define Your Risk Tolerance: Never trade with money you cannot afford to lose. Adjust your position sizes to match your comfort level with volatility.
- Use Stop-Loss Orders Wisely: Protecting capital is more important than chasing profits. Place stops below key support levels to limit downside exposure.
- Consider Dollar-Cost Averaging: If you are a long-term believer in Bitcoin, regular fixed-amount purchases can smooth out entry prices and reduce the stress of timing the market.
- Watch Volume and Confirmation: A breakdown is only as valid as the volume behind it. Wait for price confirmation before making major moves.
Remember that short-term corrections are a normal part of any asset class with the volatility profile of cryptocurrency. Panic selling often leads to buying at the bottom, while disciplined patience tends to reward investors over time.
Final Thoughts
Peter Brandt’s latest warning serves as a timely reminder that technical analysis remains a vital tool for navigating the crypto markets. A completed head and shoulders breakdown and a potential retest near $58,000 do not spell the end of Bitcoin’s long-term trajectory, but they do highlight the importance of respecting market structure and managing risk. As always, the best approach combines chart awareness, macroeconomic context, and a clear personal strategy. Whether you are a day trader looking for short-term setups or a long-term holder building a portfolio, staying informed and staying disciplined will always be your greatest advantage.