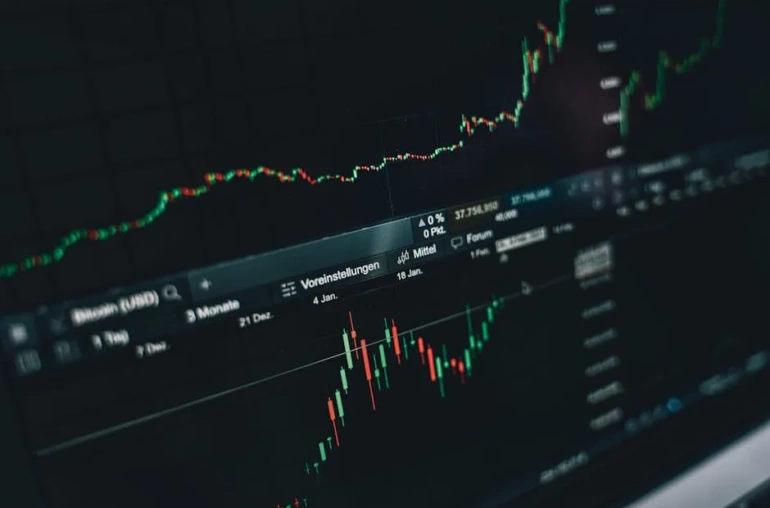
Bitcoin’s Recent Plunge: A Chartist’s Perspective
While Bitcoin’s recent price drop may have caught casual traders off guard, those closely monitoring technical indicators saw the warning signs well in advance. The cryptocurrency’s sharp decline from its recent highs wasn’t a random event—it was a textbook example of technical patterns playing out exactly as predicted.

The $108,900 Rejection That Told the Story
Bitcoin’s price action had been showing signs of weakness for weeks before the crash. A key resistance level at $108,900 became the focal point, where BTC faced strong selling pressure. This precise rejection was no accident—it aligned perfectly with earlier technical analysis that highlighted this zone as a critical make-or-break level.
Seasoned traders recognized several bearish signals leading up to the drop:
- Failed breakout attempts at key resistance levels
- Declining trading volume during upward moves
- Bearish divergence in momentum indicators like RSI
Why Technical Analysis Matters in Crypto Markets
Unlike traditional markets where fundamentals often drive price action, cryptocurrency markets are heavily influenced by technical factors due to their speculative nature and 24/7 trading. Chart patterns, support/resistance levels, and momentum indicators frequently provide reliable signals about potential market movements.
The recent BTC price action demonstrates why traders should:
- Monitor key price levels that have historically acted as turning points
- Watch for confirmation of breakouts (or rejections) with volume analysis
- Use multiple time frame analysis to understand both short-term and long-term trends
What’s Next for Bitcoin?
While the recent drop may seem alarming, it’s important to remember that volatility is inherent to cryptocurrency markets. The current pullback could represent a healthy correction before the next move higher, or it may signal a more prolonged bearish phase. Key levels to watch include:
- Support zones where buying interest may re-emerge
- Volume patterns during any recovery attempts
- Market sentiment indicators to gauge trader psychology
For traders, the lesson is clear: paying attention to chart signals can provide valuable foresight in these highly volatile markets. While no analysis is perfect, technical indicators often offer the clearest window into potential market movements before they occur.


