Is Solana’s Bull Run Over? A Look at the Charts
The cryptocurrency market is a landscape of constant flux, where technical patterns often provide clues about future price movements. For Solana (SOL), a once high-flying blockchain network, recent chart formations are painting a concerning picture for traders. Analysis across multiple time frames suggests the validation of a classic bearish reversal pattern, pointing to a potential significant price correction.
The Textbook Pattern: Head-and-Shoulders
Technical analysts are pointing to a clear “head-and-shoulders” pattern forming in Solana’s price action. This pattern is widely regarded as one of the most reliable indicators of a trend reversal from bullish to bearish. It is characterized by three peaks: a higher peak (the head) flanked by two lower peaks (the shoulders). The “neckline” is a support level drawn by connecting the low points between these peaks. A decisive break and close below this neckline is considered confirmation that the pattern has completed and the downtrend has begun.
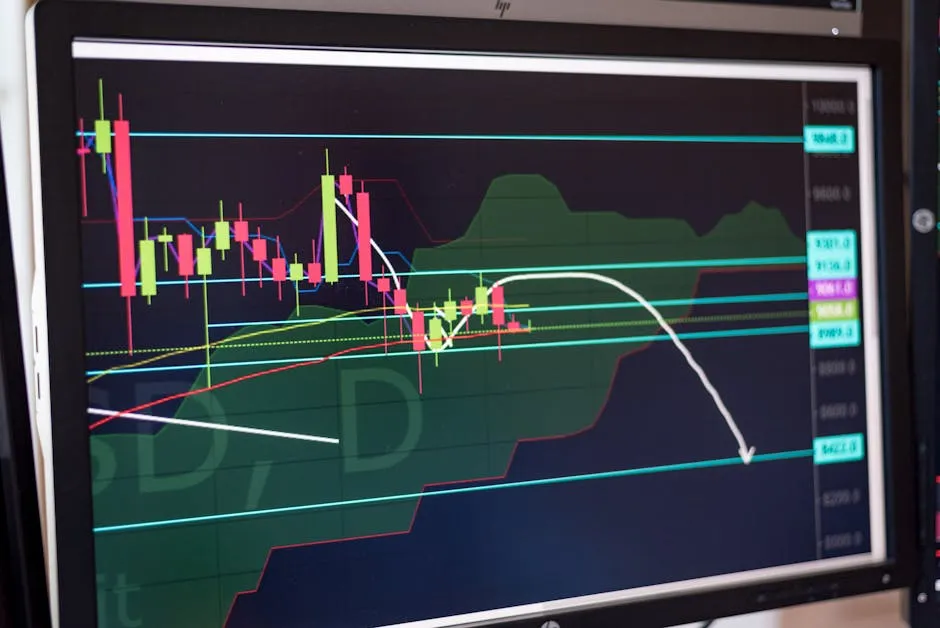
What the Charts Are Showing
According to the analysis, SOL’s price has not only formed this pattern but has also validated it by breaking below the critical neckline support. This breakdown is not isolated to a single chart; it has been observed on multiple time frames, which strengthens the signal’s significance. When a pattern appears consistently across daily, weekly, and even 4-hour charts, it suggests a broader, more sustained shift in market sentiment rather than a short-term blip.
The validation of this pattern allows analysts to project a price target. The typical method involves measuring the vertical distance from the top of the head down to the neckline. This distance is then projected downward from the point of the neckline break. For Solana, this calculation points to a potential downside target in the neighborhood of $50. This represents a substantial decline from recent price levels and underscores the severity of the bearish signal.
Context and Caution for Traders
While technical patterns are powerful tools, they are not infallible prophecies. The cryptocurrency market is influenced by a myriad of factors, including broader macroeconomic conditions, network developments, and overall investor sentiment. A bearish chart pattern can be invalidated by positive news or a sudden shift in market dynamics.
For traders and investors, this analysis serves as a crucial risk management signal. It suggests that the bullish momentum for SOL may have exhausted itself for the time being and that caution is warranted. Those holding positions might consider tightening stop-losses or re-evaluating their portfolio allocation. For others, it presents a scenario to watch closely, as a move toward the $50 target could also create new buying opportunities for those with a longer-term bullish outlook on Solana’s fundamentals.
As always, it is essential to conduct your own research and consider multiple perspectives before making any financial decisions. The charts are speaking, and for Solana, their current language is decidedly bearish.