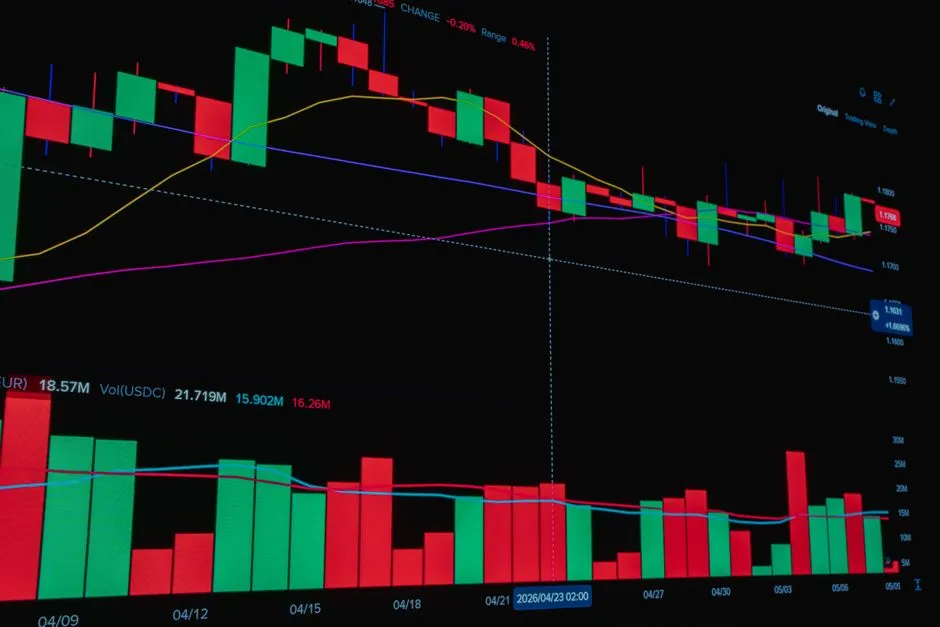
The cryptocurrency market has never been short on volatility, but when seasoned technical analysts start flashing warning signs, it is worth paying close attention. Veteran chartist Peter Brandt has once again shared a bearish outlook on Bitcoin, drawing attention to a recently completed head and shoulders breakdown on the higher timeframes. According to his analysis, this classic reversal pattern could pave the way for a significant price retest, potentially bringing Bitcoin back down to the $58,000 region.
Understanding the Technical Setup
The Head and Shoulders Breakdown
For those familiar with technical analysis, the head and shoulders pattern is widely regarded as one of the most reliable indicators of a trend reversal. It typically forms after a prolonged uptrend and signals that bullish momentum is fading. The pattern consists of three peaks: a left shoulder, a higher central head, and a right shoulder that fails to reach the height of the head. When price breaks below the neckline that connects these peaks, it confirms the breakdown and often triggers a downward correction.
Brandt’s observation centers on this exact formation on Bitcoin’s weekly chart. The recent failure to push through the next major resistance level, followed by a decisive break below the neckline, suggests that sellers have taken control. Historically, when this pattern completes on longer timeframes, the subsequent price action tends to retrace toward previous support zones. In Bitcoin’s case, that zone sits right around the $58,000 mark.
Why the $58,000 Level Matters
Support and resistance levels are not arbitrary numbers; they represent psychological and structural points where buyers and sellers have historically clashed. The $58,000 area has served as a critical floor multiple times over the past few years. During previous market cycles, this level acted as a launchpad for bullish rallies after extended periods of consolidation. If Bitcoin revisits this zone, it could either hold firm and spark a recovery, or break through and open the door to deeper corrections.
What makes this particular warning stand out is the timing. Markets are often driven by sentiment, macroeconomic shifts, and liquidity flows. When technical patterns align with broader market fatigue or shifting risk appetite, the probability of a meaningful pullback increases. Brandt’s analysis does not operate in a vacuum; it reflects a convergence of chart structure and market behavior that seasoned traders closely monitor.
Broader Market Dynamics at Play
Macro Factors and Liquidity Shifts
While technical patterns provide a roadmap, they are only one piece of the puzzle. Bitcoin’s price action is heavily influenced by external factors, including interest rate expectations, institutional capital flows, regulatory developments, and on-chain metrics such as exchange reserves and long-term holder behavior. A head and shoulders breakdown on the weekly chart often coincides with a cooling of speculative enthusiasm and a rotation of capital into safer assets.
Additionally, Bitcoin’s market structure has matured significantly. It is no longer driven solely by retail frenzy or isolated news events. Instead, it reacts to macroeconomic data, futures market positioning, and derivative liquidations. When these elements align with a bearish technical setup, the resulting downside pressure can be both swift and sustained. That is why many traders are watching the $58,000 level closely in the coming weeks.
On-Chain and Sentiment Indicators
Beyond the charts, on-chain data often provides early clues about market health. Metrics like exchange inflows, stablecoin supply ratios, and miner behavior can indicate whether selling pressure is organic or forced. If long-term holders begin distributing coins while exchange balances rise, it typically confirms that the technical breakdown is backed by actual market activity. Conversely, if buying volume remains strong at key support levels, the market may reject the lower price targets and stage a quick recovery.
Strategic Considerations for Traders
Risk Management and Position Sizing
Navigating a potential price retest requires discipline and a clear strategy. Rather than reacting emotionally to short-term volatility, experienced investors focus on risk management, position sizing, and predefined exit points. If you hold Bitcoin long-term, a dip toward $58,000 might present a strategic accumulation opportunity, provided the broader trend remains intact. However, for active traders, waiting for confirmation before entering positions is often the safer route.
Key Levels to Watch
Key levels to monitor include the neckline of the head and shoulders pattern, the $60,000 psychological barrier, and the $58,000 support zone. A bounce off $58,000 with strong volume could signal resilience, while a clean break below it may indicate a deeper correction toward $52,000 or lower. Setting stop-losses, avoiding excessive leverage, and keeping an eye on higher timeframe structure will help traders stay grounded during periods of heightened uncertainty.
Final Thoughts
Peter Brandt’s latest analysis serves as a timely reminder that technical structure still plays a vital role in Bitcoin’s price discovery. A completed head and shoulders breakdown is not a guarantee of what will happen next, but it is a strong signal that bears are gaining traction. Whether Bitcoin actually revisits $58,000 or finds support higher up will depend on a combination of market sentiment, liquidity conditions, and how traders react to key levels. As always, patience, preparation, and a clear understanding of risk will be the difference between thriving and getting caught off guard in this highly dynamic market.