The Catalyst: Softer CPI Data and Market Reaction
Cryptocurrency markets have never operated in a vacuum. While blockchain technology and decentralized finance often take center stage in community discussions, traditional macroeconomic indicators continue to dictate short-term price action. The most recent example of this dynamic unfolded when Ethereum surged past a critical resistance level following the release of U.S. inflation data. June’s Consumer Price Index (CPI) came in softer than anticipated, signaling that price pressures may finally be easing. For risk assets like digital currencies, this type of economic relief is often interpreted as a green light. Investors and algorithmic traders quickly adjusted their positions, fueling a sharp upward move that placed the $1,850 mark back in the spotlight.
Breaking the $1,850 Barrier: Technical Breakdown
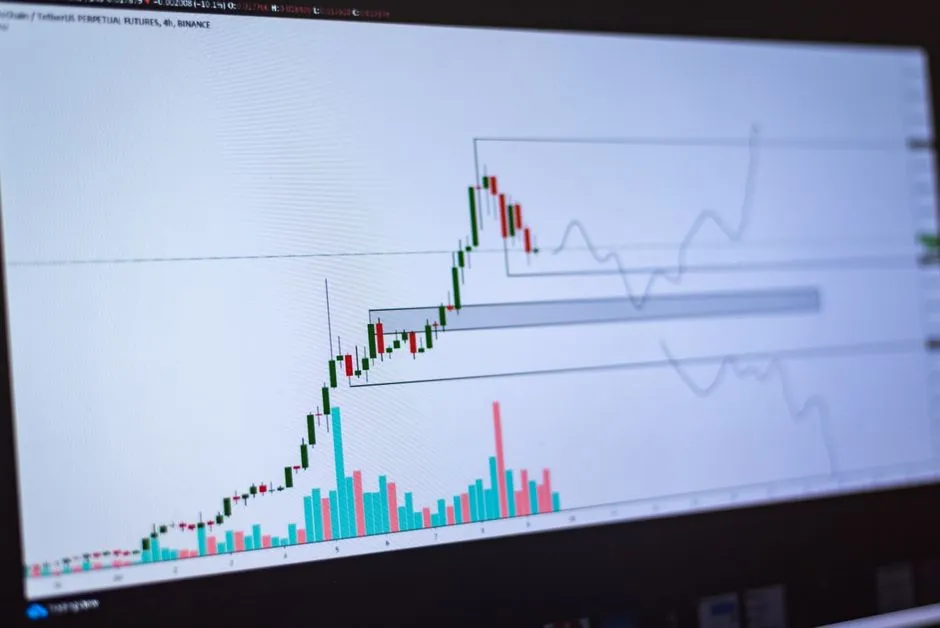
In technical analysis, resistance levels act as psychological and mathematical ceilings where selling pressure historically overcomes buying interest. When an asset closes decisively above such a threshold, it often flips that resistance into support, creating a foundation for further upside. Ethereum’s move above $1,850 was not a fleeting wick but a sustained breakout accompanied by rising trading volume. This suggests that institutional and retail participants are aligning around a new price equilibrium. The network’s underlying fundamentals, including steady staking yields and growing decentralized application activity, provide a structural backbone that helps sustain these technical breakouts when macro conditions turn favorable.
Why Resistance Levels Matter
Understanding why certain price points hold so much weight requires looking at market psychology. Traders place stop-loss orders, limit orders, and options contracts around round numbers and historical highs. When price action clears these zones, it triggers a cascade of automated buying and forced cover orders. The $1,850 level had acted as a ceiling for weeks, absorbing multiple buying attempts. Once it finally broke, the shift in market sentiment was immediate, turning cautious观望 into active accumulation.
The Short Squeeze Phenomenon
The rapid ascent above $1,850 was heavily accelerated by a classic short squeeze. In leveraged markets, traders frequently bet against an asset by borrowing and selling it, expecting to buy it back at a lower price. When the opposite occurs and prices rise sharply, these traders face margin calls. To avoid liquidation, they are forced to buy back the asset at current market prices, which injects additional buying pressure and pushes the price even higher. Ethereum’s recent move exhibited all the hallmarks of this mechanism: compressed volatility followed by an explosive upward candle, accompanied by a noticeable drop in open interest on the bearish side. This feedback loop can sustain momentum for days, provided volume remains healthy.
Is $2,000 the Next Logical Target?
With the $1,850 resistance now cleared, the $2,000 level has naturally become the next focal point for market participants. Historically, Ethereum has shown a tendency to respect clean, round-number psychological barriers. Reaching $2,000 would require sustained buying pressure and, crucially, a consolidation phase where the market digests recent gains. If Ethereum can hold above $1,850 on daily closes and see accumulation from long-term holders, the path toward $2,000 becomes structurally viable. However, it is important to remember that crypto markets remain highly sensitive to shifting liquidity conditions, regulatory headlines, and broader equity market movements.
Key Indicators to Watch
- On-chain exchange balances: A steady decline in Ethereum held on centralized exchanges often signals long-term accumulation rather than short-term speculation.
- Funding rates on perpetual contracts: Excessively positive funding rates can indicate overcrowded long positions, which may lead to a healthy pullback before further upside.
- U.S. Treasury yields and dollar strength: Since crypto assets are priced in dollars and compete with traditional fixed-income instruments, shifts in interest rate expectations will continue to influence capital flows.
What Traders Should Watch Next
While the technical setup looks constructive, prudent market participants know that breakouts rarely move in straight lines. The weeks following a macro-driven surge are often characterized by sideways consolidation as profit-taking balances new buying interest. Traders should monitor volume profiles closely; a healthy rally requires consistent participation rather than sporadic spikes. Additionally, keeping an eye on upcoming economic reports, Federal Reserve commentary, and network upgrade timelines will provide context for how Ethereum navigates the road ahead. Patience and disciplined risk management will separate those who capitalize on momentum from those who get caught in false breakouts.
The intersection of favorable inflation data, technical breakout confirmation, and leveraged market dynamics has placed Ethereum in a constructive position. While no one can predict exact price movements with certainty, the alignment of macro relief and on-chain strength suggests that the $2,000 threshold is no longer a distant fantasy but a tangible objective. As always, staying informed, managing exposure, and respecting market structure will be the most reliable tools for navigating the months ahead.