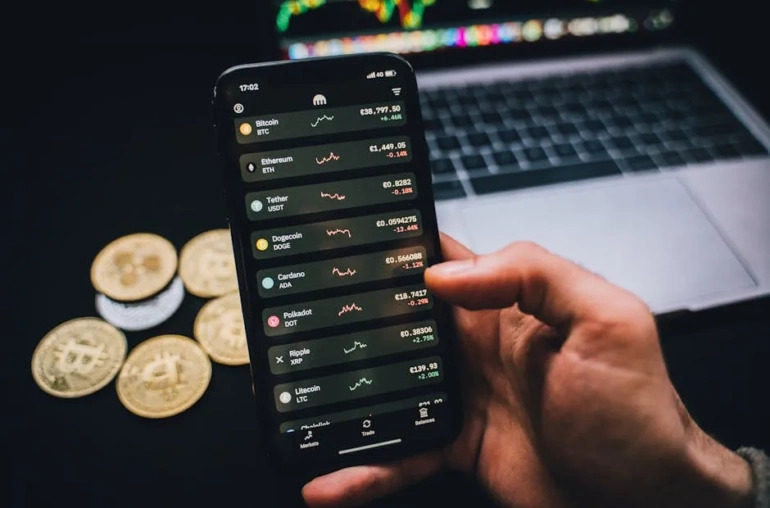
The cryptocurrency market is defined by its unpredictability, yet history often provides a map for where prices might head next. Recently, Solana (SOL) has caught the attention of traders and investors alike. A specific chart pattern that flashed on the market appeared again, signaling a potential shift in momentum. This pattern is not just a random occurrence; it is linked directly to a massive price movement in the past. When this specific setup appeared previously, it preceded a staggering 142% rally. Now that the same signal is flashing again, the question becomes: are the bulls gearing up for another significant run?
Understanding the Historical Context
To understand the significance of this new signal, one must look back at the previous instance. In the volatile world of digital assets, a rally of 142% is not a minor fluctuation; it represents a fundamental change in market sentiment and capital inflow. When that specific chart pattern materialized before, it served as a precursor to a breakout that defied many bearish expectations at the time. This kind of technical setup is often referred to as a bullish continuation or reversal pattern, suggesting that the price has found support and may be ready to surge upwards again.
The reason this pattern is so compelling is its repetition. In technical analysis, the adage “history repeats itself” is taken quite literally. If a price action pattern has shown a high success rate in the past, traders pay close attention when it reappears. The current setup on Solana mirrors the conditions of that previous rally, creating a narrative of potential opportunity for those watching the altcoin sector closely.
What the Chart Pattern Indicates
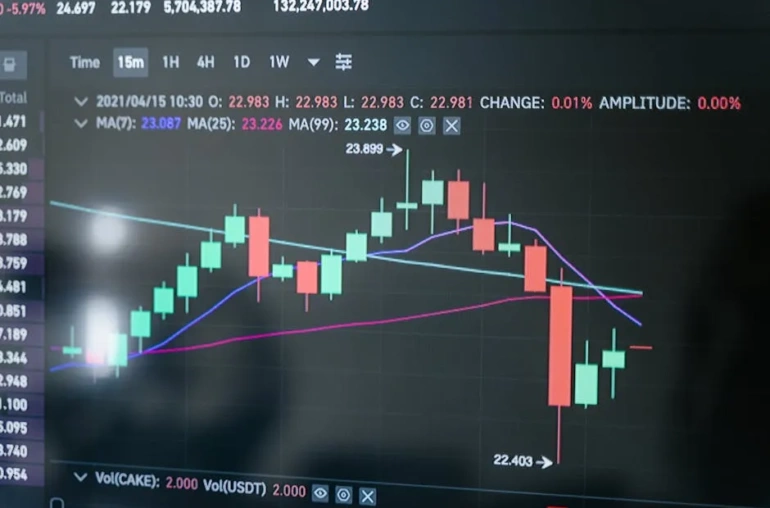
While the exact visual details of the chart are complex, the core concept revolves around price consolidation and momentum building. Typically, these patterns occur after a period of sideways movement or a slight pullback. This allows the market to “digest” previous gains before attempting a new leg up. For Solana, appearing on this signal suggests that the coin may have completed a consolidation phase.
- Consolidation: A period where price volatility decreases, often forming tight ranges.
- Support Levels: The formation suggests strong buying interest at lower price points.
- Momentum: The potential for a breakout indicates that buying pressure is starting to outweigh selling pressure.
When this combination aligns, it often triggers a cascade of buying activity from retail investors and institutional traders alike. The psychological aspect is just as important as the math; seeing a known bullish pattern can encourage traders to enter positions, which in turn fuels the rally.
Market Sentiment and the Altcoin Narrative
Solana has been one of the standout performers in the altcoin space, particularly known for its high throughput and low transaction costs. However, price action is rarely isolated. The current signal for Solana is happening within the broader context of the crypto market. Bitcoin often acts as the anchor, and if the broader market is bullish, an altcoin with a strong technical signal like this one is more likely to see significant gains.
However, if the broader market is bearish, even a strong technical setup may face headwinds. Therefore, the success of this potential rally depends heavily on the overall health of the crypto ecosystem. Traders are watching to see if this SOL signal is an isolated event or the beginning of a broader altcoin season. If the bulls are indeed returning to Solana, it could signal renewed confidence in the technology and the project behind the coin.
Risks and Considerations for Investors
While the potential for a 142% rally is enticing, it is crucial to approach this with caution. Technical patterns are not guarantees. False breakouts happen frequently in the crypto market. A pattern that looked like a support level could suddenly break downwards if major news or regulatory developments occur.
Investors should always practice risk management. This means setting stop-loss orders to protect capital if the trade goes against them. It is also important to diversify and not put all funds into a single asset, even if the technical outlook seems promising. The crypto market is 24/7, and news can change a price action pattern overnight.
Conclusion
The reappearance of the chart pattern that previously fueled a massive rally for Solana is a notable development. It suggests that the “bulls” may be back in the driver’s seat for this specific asset. However, like all market movements, there is no certainty. The best approach is to watch how the price reacts over the coming days and weeks, keeping an eye on volume and broader market trends. For those interested in Solana, this signal warrants close attention, but it should be viewed as one piece of a much larger puzzle in the complex world of cryptocurrency trading.